Price Action Trading Strategy
For those new to trading, the first glance at a trading platform can be intimidating. You are likely confronted with a chaotic mosaic of colored lines, squiggly indicators, and oscillators that promise to predict the future. It is easy to fall into the trap of believing that more “stuff” on your chart leads to better decisions.
However, the most successful institutional and retail traders rely on something far simpler, yet profoundly more effective. It is called Price Action.
In this guide, we will strip away the noise. We will explain what Price Action is, why it works, and how you can use it to trade currencies with confidence—even if you have never placed a trade before.
What is Price Action?
Price Action is the study of an asset’s price movement over time. Unlike complex indicators (like RSI, MACD, or Stochastic) which are derived from mathematical formulas, Price Action is raw data. It is the footprint of every buyer and seller in the market at that exact moment.
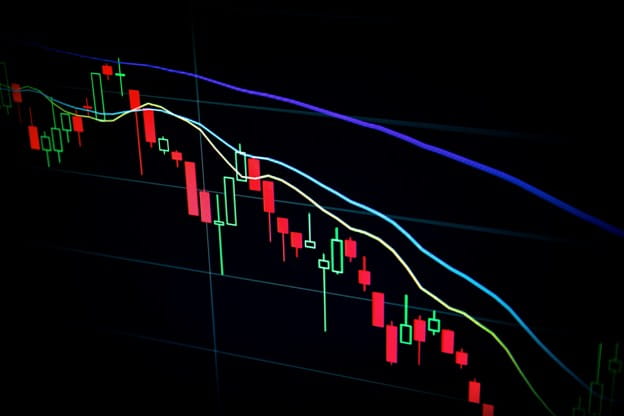
On a Forex chart, this data is usually displayed as candlesticks or bar charts. Each candle tells a story:
- The Open: Where the price started.
- The High: The maximum price buyers pushed to.
- The Low: The minimum price sellers pushed to.
- The Close: Where the price finished.
By analyzing these four data points across multiple candles, you can identify trends, reversals, and moments of market indecision. In essence, Price Action is learning to read the market’s body language without a translator.
Why Ignore the Indicators?
If you ask a search engine for “best Forex indicators,” you will receive thousands of results. So, why would a beginner choose to ignore them?
The answer is lag and subjectivity. Most indicators are lagging—they tell you what happened ten minutes ago, not what is happening now. Furthermore, if ten traders look at the Stochastic Oscillator, they might get ten different signals depending on their settings.
Price Action is objective. It is the cause; indicators are the effect. By learning Price Action, you cut out the middleman. You are trading the market, not a spreadsheet of someone else’s math.
The Core Building Blocks of Price Action
Before you look at a live chart, you need to understand the three fundamental truths of market movement. Every Price Action strategy relies on these three states:
- Uptrend: The market is making higher highs (HH) and higher lows (HL). Buyers are in control.
- Downtrend: The market is making lower highs (LH) and lower lows (LL). Sellers are in control.
- Range (Sideways): The market is moving horizontally between support (floor) and resistance (ceiling). Neither side has control.
Your job as a Price Action trader is simply to identify which of these three states the market is in right now, and trade in that direction.
The Essential Candlestick Patterns
You do not need to memorize 50 patterns to be successful. In fact, 90% of profitable Price Action trading comes from just three formations.
1. The Pin Bar (The Rejection Candle)
The Pin Bar looks like a shooting star or a hammer. It has a long wick (shadow) and a small body.
What it tells you: The market tried to move in one direction (e.g., down) but was violently rejected and closed near the opposite end (e.g., up).
How to use it: If you see a long wick at a support level, it signals a potential move upward. If you see a long wick at a resistance level, it signals a potential move downward.
2. The Engulfing Candle (The Takeover)
This is a two-candle pattern. The second candle completely “engulfs” the body of the previous candle.
What it tells you: A sudden change in momentum. Bulls have completely overwhelmed bears (or vice versa).
How to use it: A bullish engulfing at the bottom of a downtrend suggests the trend is reversing to the upside.
3. The Inside Bar (Indecision)
This is a small candle that forms entirely within the high and low range of the previous larger candle (the “mother bar”).
What it tells you: The market is coiling like a spring. Volatility is contracting.
How to use it: Wait for the price to break above or below the mother bar. That breakout is usually the start of the next big move.
A Simple Step-by-Step Price Action Strategy
Let’s put this knowledge into a repeatable framework. This is a strategy known as “Trend Pullback” —it is ideal for beginners because it minimizes risk.
Step 1: Determine the Daily Trend
Zoom out to the 4-hour or Daily chart. Ask yourself: Are we making Higher Highs? If yes, we are only looking for Buy signals. Never trade against the daily trend.
Step 2: Identify a Key Level
Draw horizontal lines on recent highs (resistance) and lows (support). We are looking for price to return to a previous “value area.”
Step 3: Wait for the Pullback
In an uptrend, price rarely goes straight up. It goes up, then pulls back down slightly. Wait for price to pull back to a support level you identified in Step 2.
Step 4: Look for Your Signal
At that support level, wait for a Bullish Pin Bar or an Engulfing Candle to form. This confirms that buyers are stepping in at that exact level to defend the trend.
Step 5: Execute and Manage Risk
Place a Buy order. Set your Stop Loss just below the low of your signal candle. Set your Take Profit at the next resistance level above.
Example: You see the EUR/USD is in a strong uptrend. It pulls back to a previous resistance-turned-support at 1.0850. A Hammer (Pin Bar) forms here. You buy at 1.0860, stop at 1.0840, target 1.0900. The risk is 20 pips to make 40 pips (a 1:2 risk/reward ratio).
The Golden Rule: Support and Resistance
A Price Action strategy is useless without understanding Support and Resistance (S/R) . These are psychological levels where the market has historically reversed.
Support: A floor where buying pressure overwhelms selling pressure.
Resistance: A ceiling where selling pressure overwhelms buying pressure.
Institutional traders (banks and hedge funds) place massive orders at these levels. As a retail trader, you are simply “hitching a ride” on their flow. The pin bars and engulfing candles we discussed are the visual evidence that those big players have entered the market at those S/R levels.
Common Mistakes to Avoid
While Price Action is simple, it is not easy. Beginners often fall into three traps:
Forcing the Trade: Not every candle is a signal. If the price is choppy sideways with no clear patterns, do nothing. Patience is a superpower.
Ignoring the Higher Timeframe: A bullish pin bar on a 1-minute chart means nothing if the Daily chart is in a violent downtrend. Always align your trades with the higher timeframe trend.
Moving the Stop Loss: Never move your stop loss further away because you are scared of being wrong. If the price hits your stop, the trade was wrong. Accept the small loss and wait for the next setup.
Conclusion: The Journey to “Naked Trading”
The ultimate goal of a Price Action trader is often called “Naked Trading” —looking at a blank chart with no indicators, just price and levels. It allows you to see the market’s true structure without the distortion of lagging algorithms.
For the absolute beginner, the path is clear:
- Open a Demo Account.
- Remove all indicators (RSI, Moving Averages, etc.).
- Practice drawing horizontal Support/Resistance lines.
- Identify Pin Bars and Engulfing patterns at those lines.
Price Action does not predict the future—nothing can. But it gives you a probabilistic edge. It tells you where the big money is flowing and when to join them. In the chaotic 24-hour world of Forex, that clarity is the most valuable tool you will ever own.
Disclaimer: Trading Forex carries a high level of risk and may not be suitable for all investors. You should be aware of all the risks associated with foreign exchange trading.